Monitor
unseenet-monitor shows how your node is doing, at a glance: traffic in the
last hour, your peers and whether they answer, storage, Tor, warnings and
the node's last log lines.
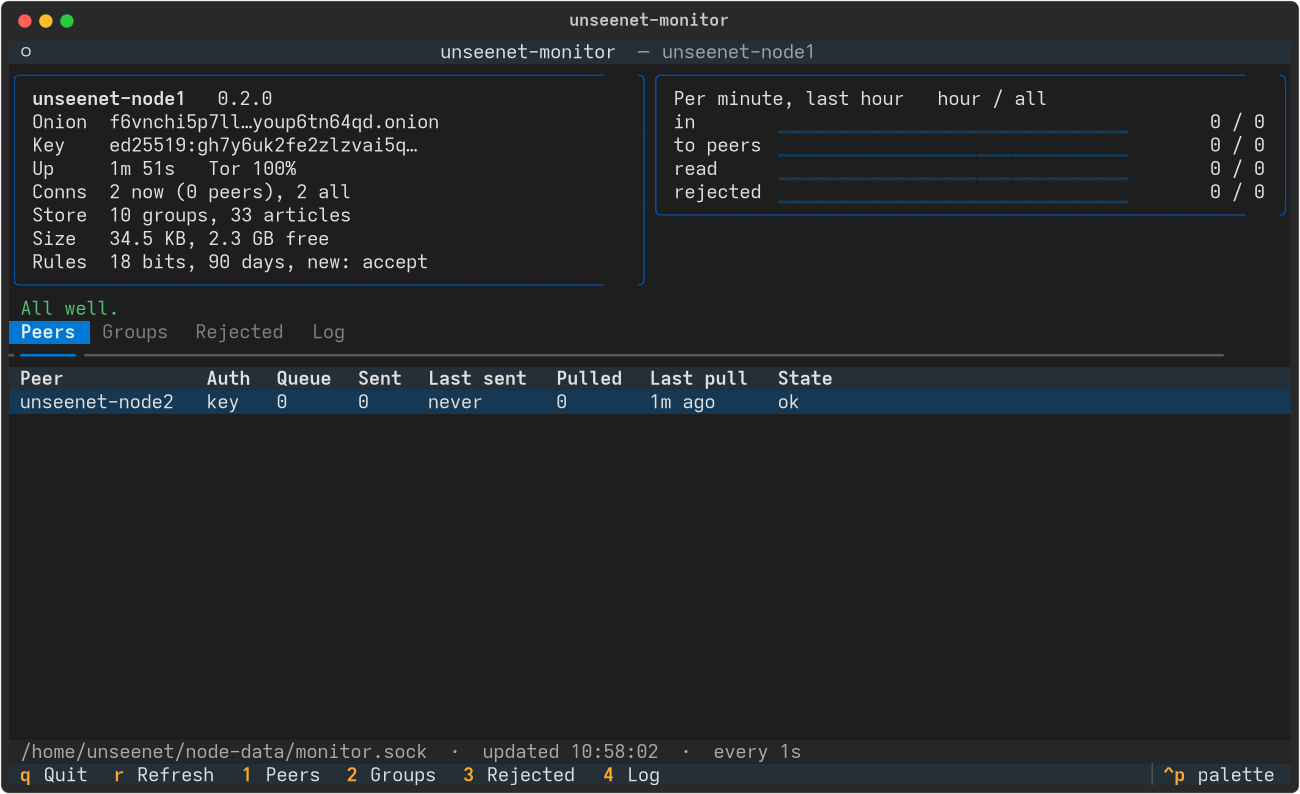
It is a program of its own. It only reads from the node and cannot change anything; the node runs on whether the monitor is open or not.
Start it
On a node set up with install-node.sh, just run:
unseenet-monitor
That starts it as the node's user, who owns the stats socket. Elsewhere, run it as the node's user yourself:
sudo -u unseenet /home/unseenet/unseenet/.venv/bin/unseenet-monitor
It finds the node in the usual places (node-data/monitor.sock in the
current directory, in your home, or in /home/unseenet). Otherwise name the
node's stats socket:
unseenet-monitor --node /home/unseenet/node-data/monitor.sock
Over SSH it works the same way: ssh -t mynode sudo -u unseenet .../unseenet-monitor.
Several nodes on one machine? Give --node once for each, and switch with
N and P.
The monitor needs Textual, like the client: pip install "unseenet[monitor]"
(install-node.sh installs it).
| Key | |
|---|---|
| 1 ... 4 | Peers, Groups, Rejected, Log |
| N / P | Next / previous node |
| R | Refresh now (it refreshes every 2 seconds) |
| Q | Quit |
What it shows
- The node: name, version, onion address, node key, uptime, Tor, open connections, groups and articles, storage and free disk, its policy.
- Per minute, last hour: articles accepted (from clients, peers and catching up), sent to peers, read by clients, rejected - and the totals since the node started.
- Warnings: Tor not running or still starting, a peer that has not answered for a day, a long queue for a peer, little disk space.
- Peers: how each is authenticated, articles waiting and sent, the last catch-up (UN-RFC 0017) and the last error.
- Groups: the groups with the most articles.
- Rejected: why articles were refused (postage, signature, size, unknown group, duplicate, ...) - a sudden rise can mean someone is testing your node.
- Log: the node's last log lines.
The stats interface
The node serves the numbers on a Unix socket in its data directory,
monitor.sock, readable only by the node's user (and its group). It is never
reachable over Tor, and the node refuses to serve it on anything but this
computer.
unseenet-node --data node-data --monitor node-data/monitor.sock   # the default
unseenet-node --data node-data --monitor 127.0.0.1:1120           # Windows, tests
unseenet-node --data node-data --monitor off
It answers one request per line with one line of JSON: stats gives a
snapshot, log 100 the last log lines. That makes it easy to use from other
tools as well:
printf 'stats\n' | sudo -u unseenet nc -U /home/unseenet/node-data/monitor.sock | jq .traffic
The format is described at the top of src/unseenet/node/stats.py ("v": 1).
Nothing about readers
The numbers are counters only. The node does not record who reads what - not even which groups or articles are read, only how many articles were served in total - as the node's logging policy (UN-RFC 0011) promises.